Calendar Dashboard for Sales Order
A calendar chart is a visualization used to show activity over the course of a long span of time, such as months or years. They're best used when you want to illustrate how some quantity varies depending on the day of the week, or how it trends over time.
-
 Community
-
Enterprise
-
Odoo.sh
Features
- Light, Dark and Vivid three different themes available
- Total and Count mode available.
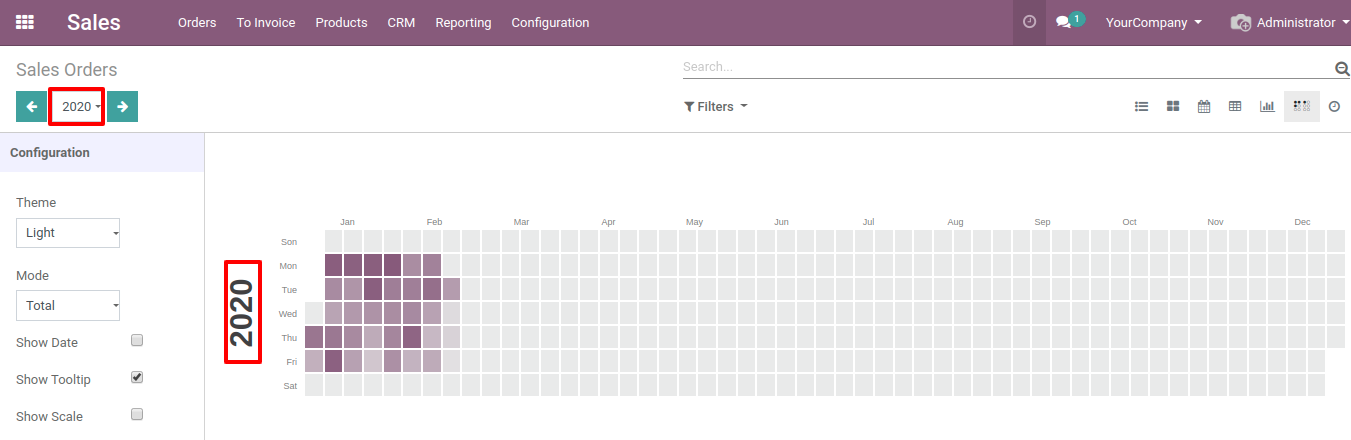
- User can select year so user can analyse past data using calendar chart.
- User can easily configure show date, show tooltip, and show scale to analyse calendar chart.
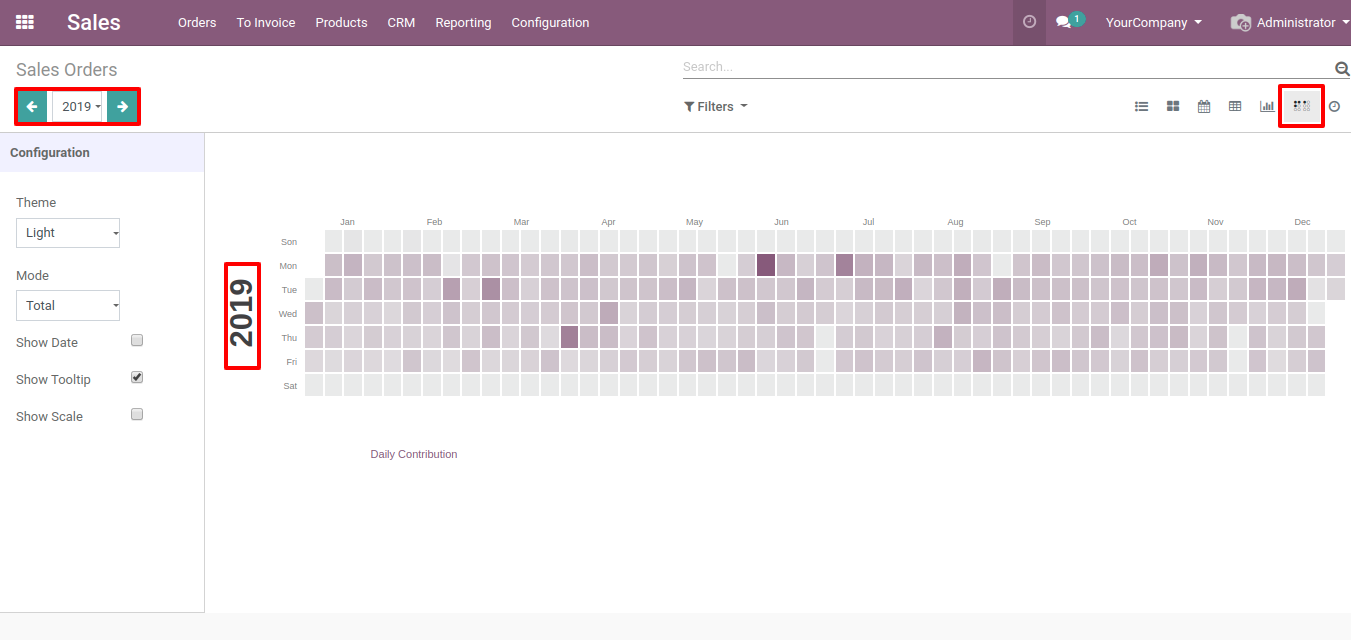
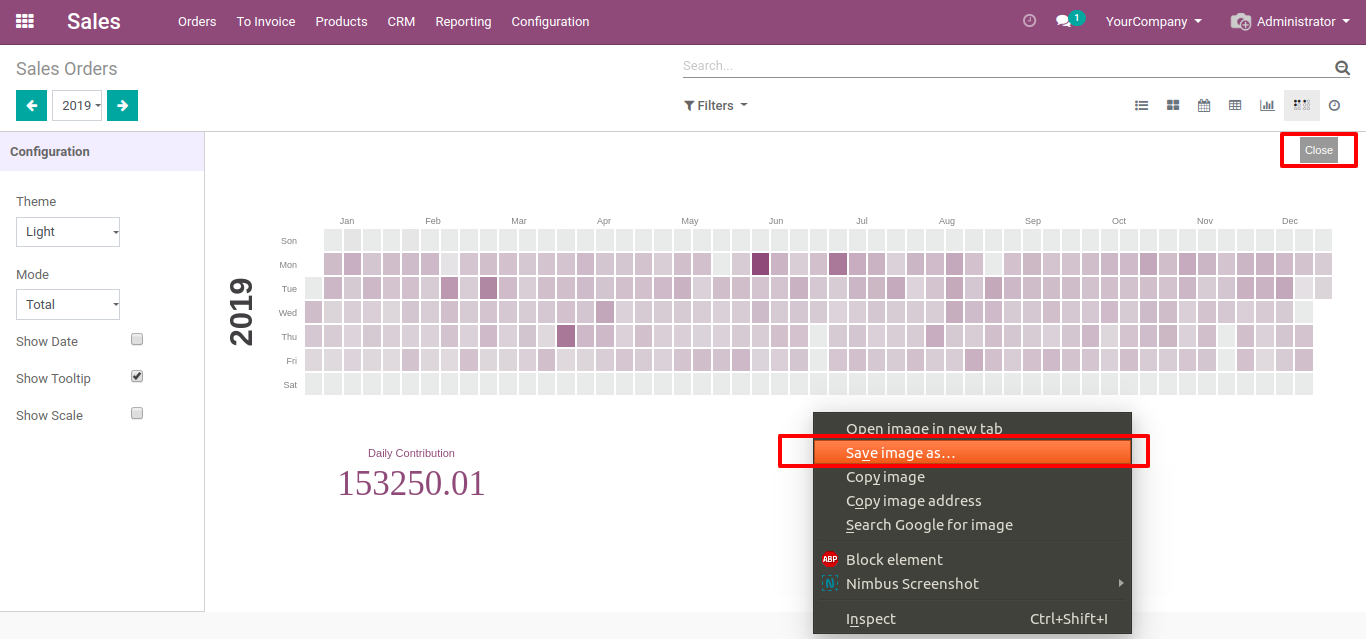
Calendar Chart view in Sale Order
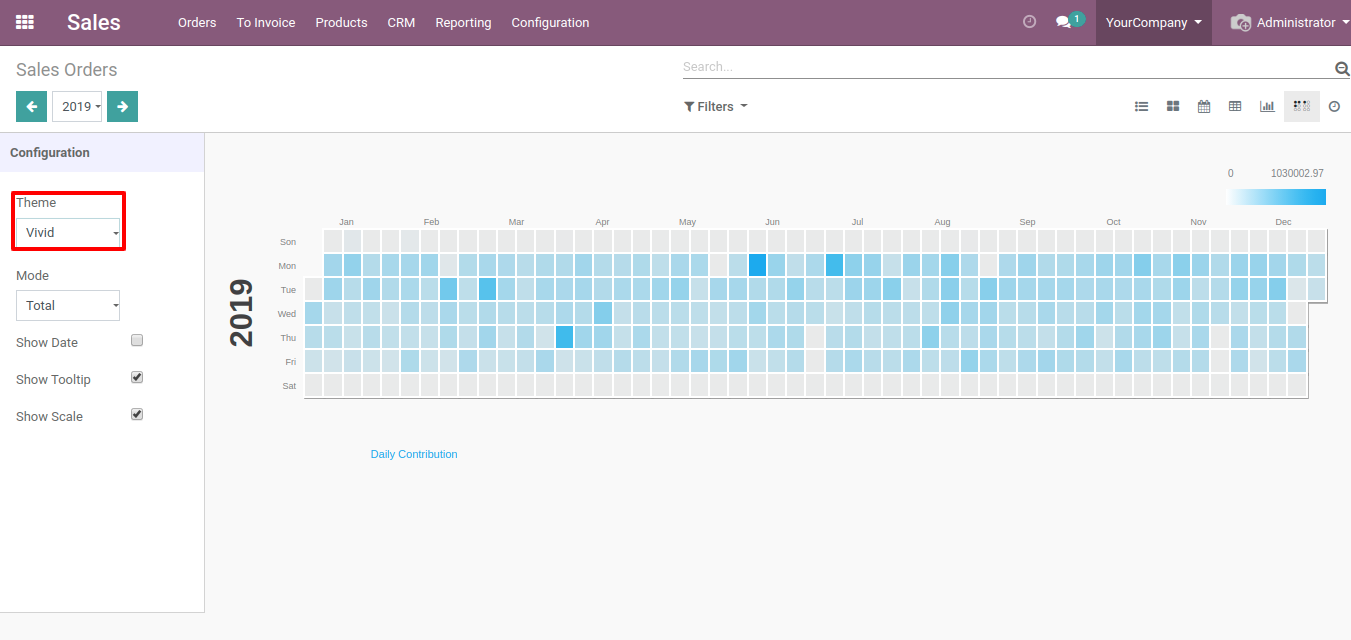
Themes (Light/Dark/Vivid)
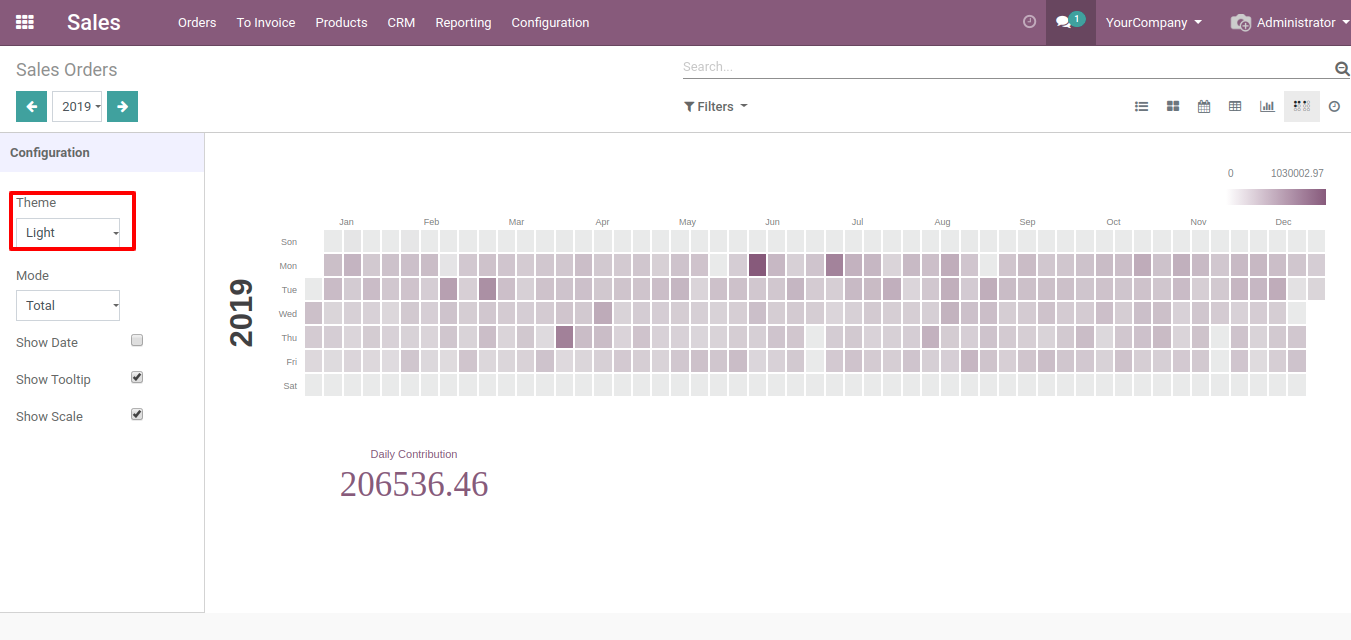
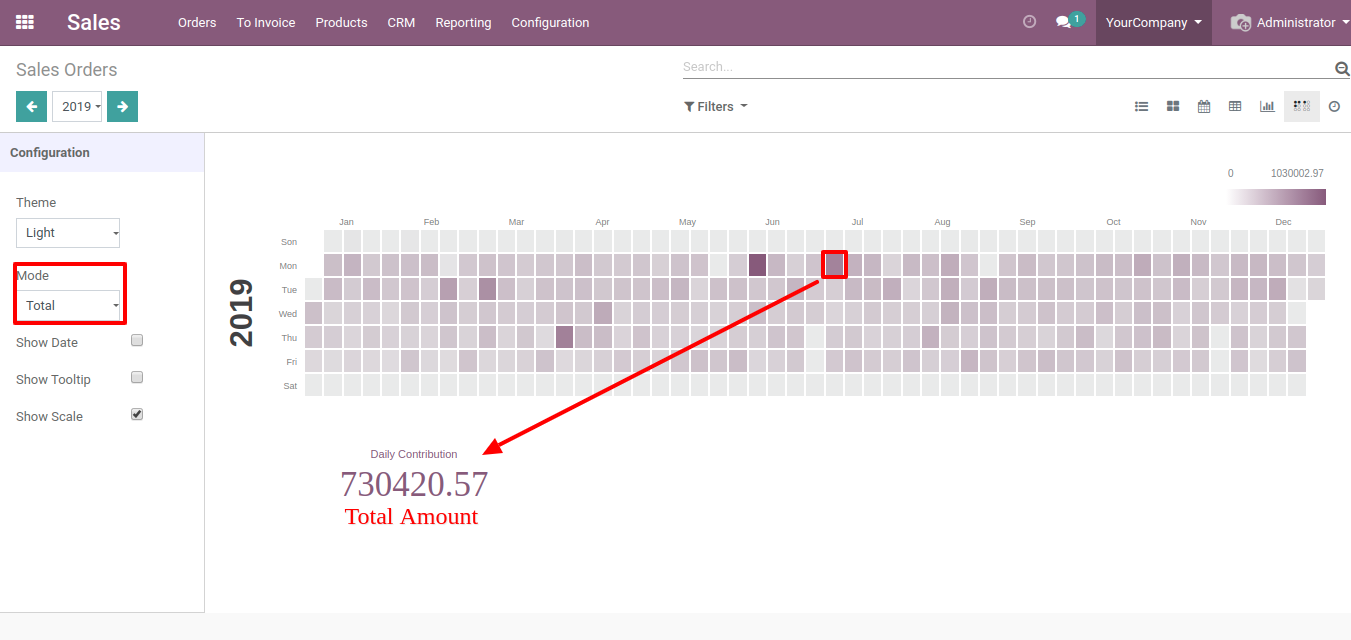
- Light Theme
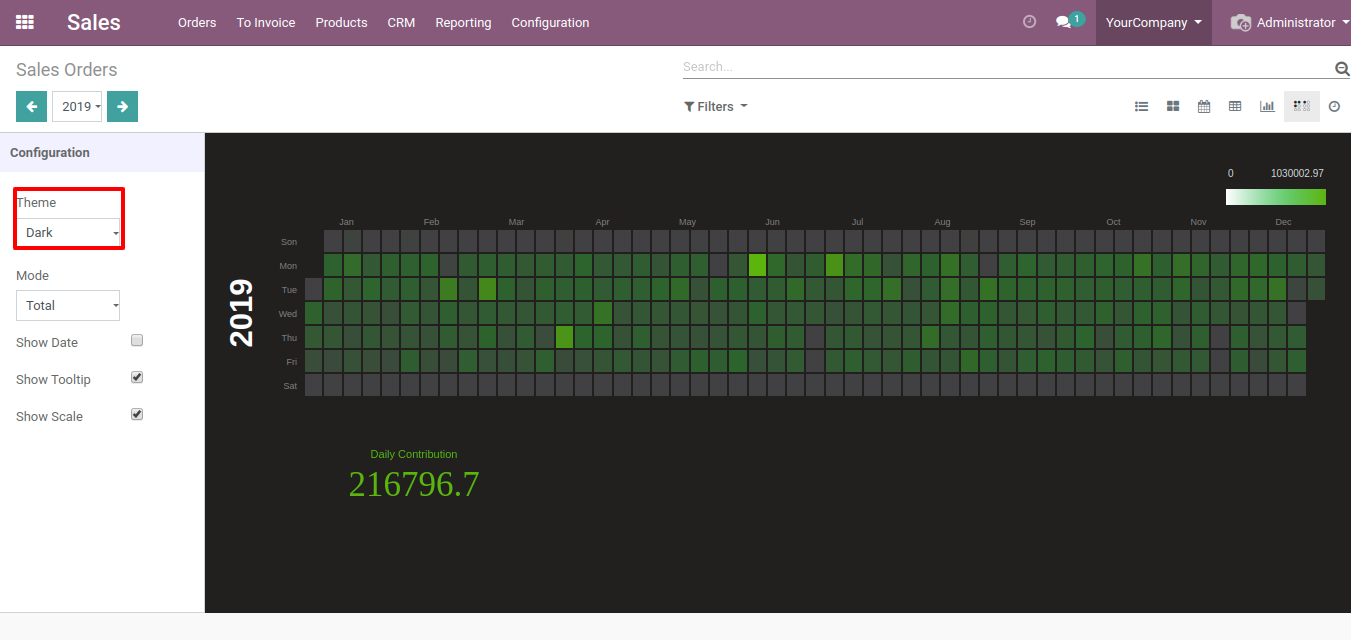
- Dark Theme
- Vivid Theme
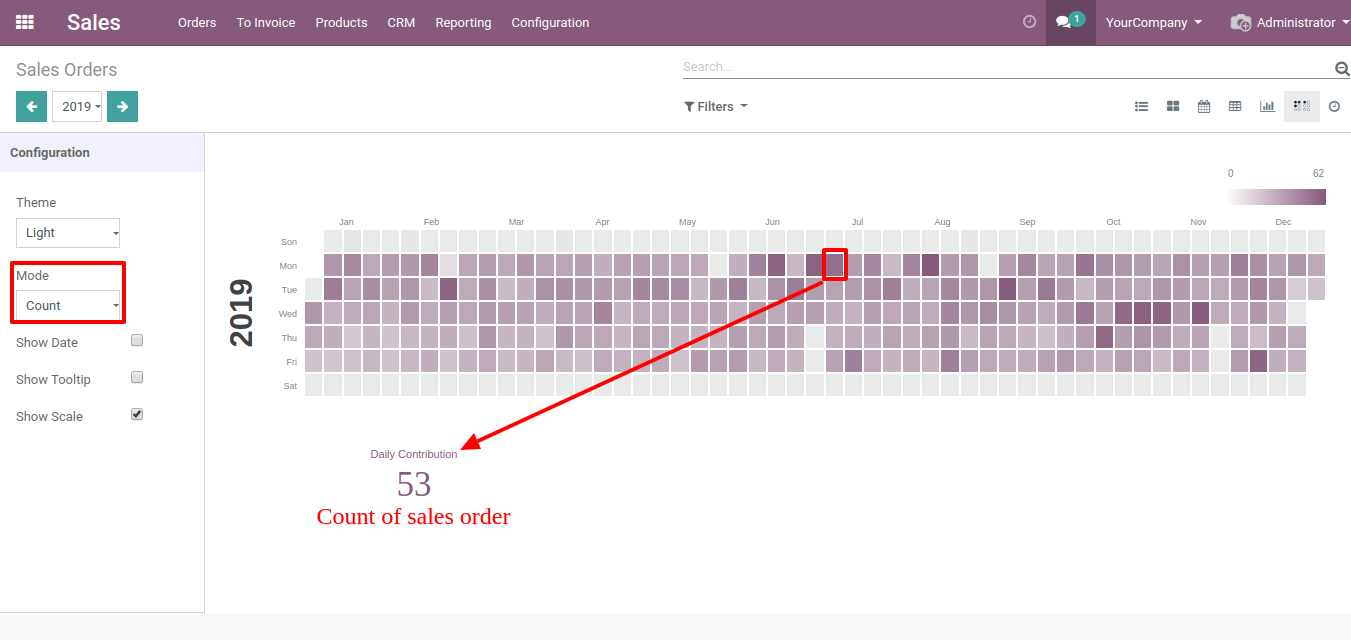
Mode (Total/Count)
- Total: Total mode shows total amount of sales order for particular day.
- Count Mode: Count mode shows the count of sales order for particular day.
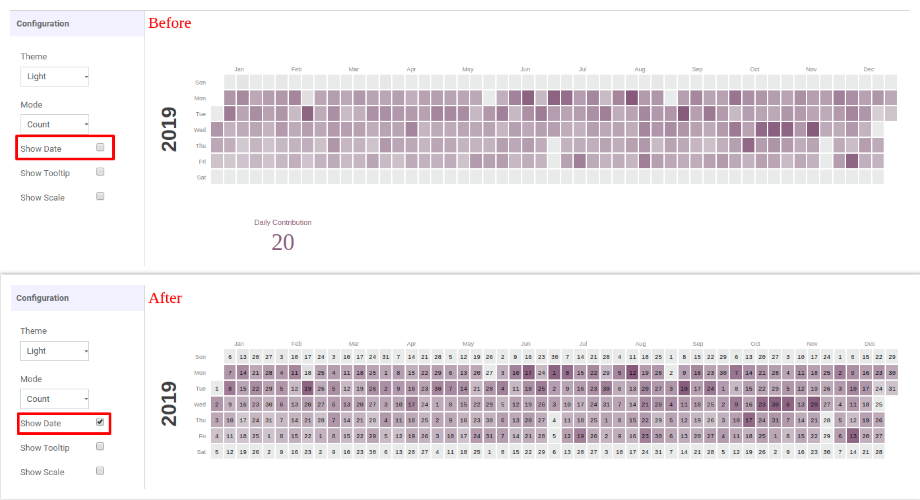
Show Date
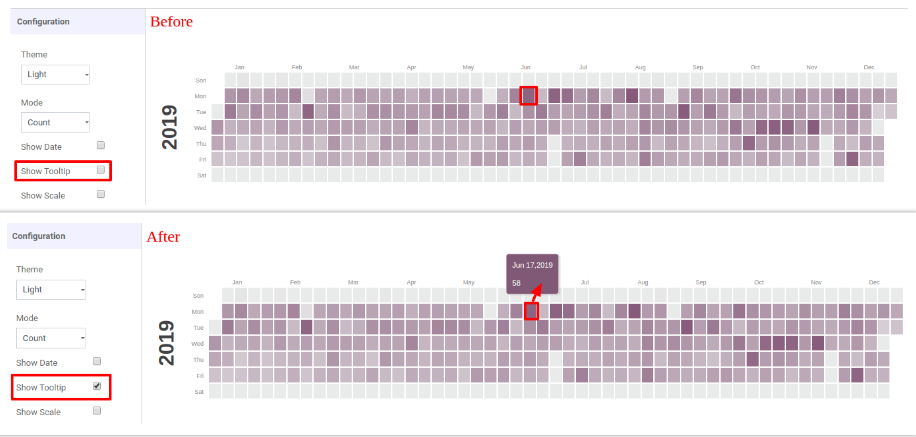
Show Tooltip
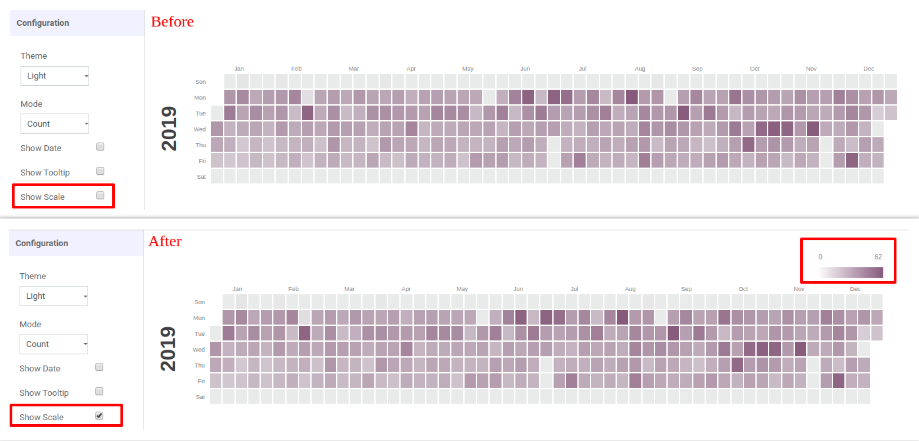
Show Scale
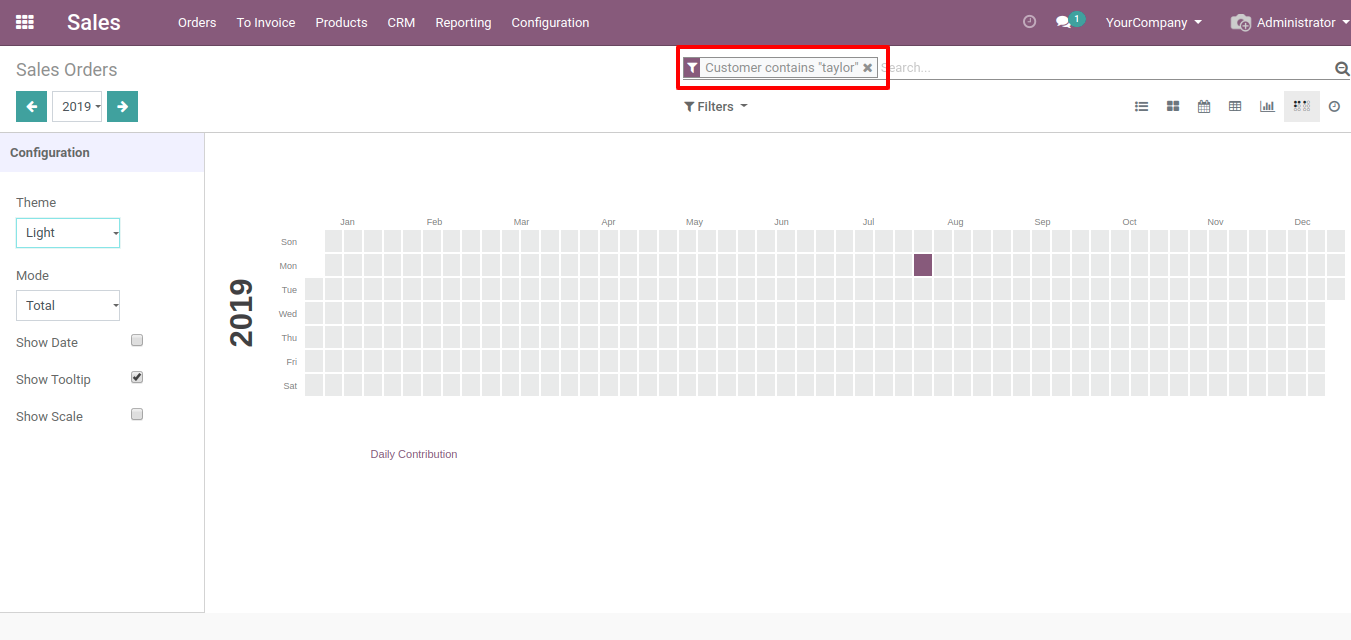
Filters
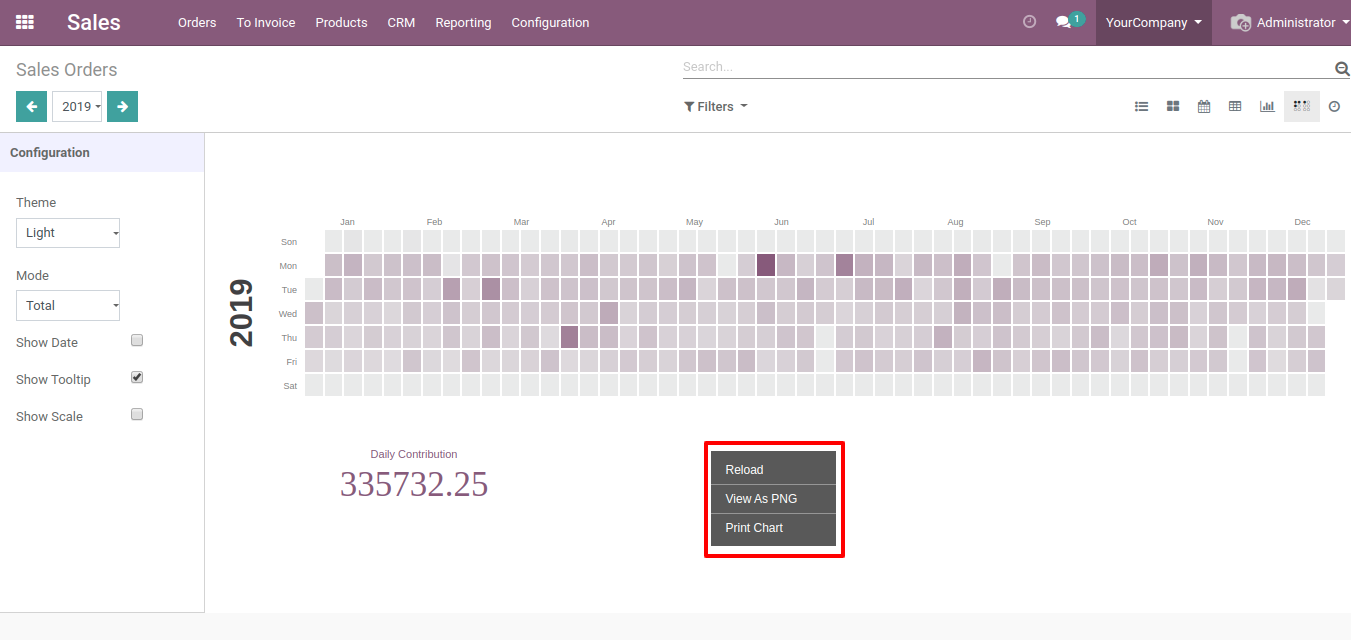
Download/Print Calendar Chart
Complimentary Support
You will get 90 days free support for any doubt, queries, and bug fixing (excluding data recovery) or any type of issue related to this module.
Help & Support
Contact us at
info@craftsync.com
for any query.